Investment Portfolio Sincera 30
Characteristics: Regular income as well as capital gains
Investment Horizon: Mid-term
Risk Profile:
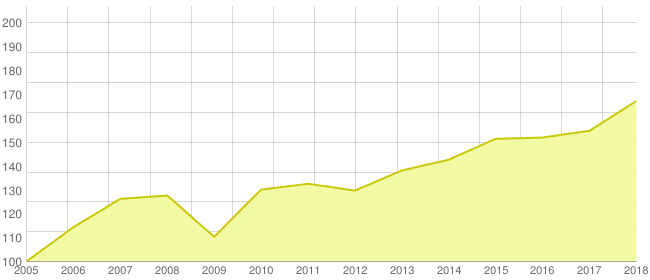
Average Annual Return and Risk (2005 - 2017)
| Ø Annual Return * |
4.04% |
| Volatility (Risk) ** |
5.5% |
| Best performing year * |
17.91% (2009) |
| Worst performing year * |
-13.56% (2008) |
* Performance in CHF, net of fees. Historical performance is based on approximation of the relevant Index Time Series within each investment strategy. Historical performance does not indicate or guarantee future returns.
** For approx. 68% of all possible outcomes the annual return fluctuates +/-5.5% or less around the mean (expected) return.
For approx. 95% of all possible outcomes the annual return fluctuates +/-11% or less around the mean (expected) return.
Asset Allocation
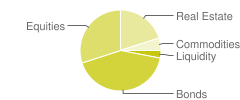
| Asset Class |
Percentage |
| Liquidity |
3.0% |
| Bonds |
42.0% |
| Equities |
30.0% |
| Real Estate |
20.0% |
| Commodities |
5.0% |
| Total Investment |
100.0% |
Currencies
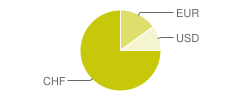
| Currency |
Percentage |
| CHF |
75.0% |
| EUR |
15.0% |
| USD |
10.0% |
| Total |
100.0% |
Annual Returns *
| 2005 |
2006 |
2007 |
2008 |
2009 |
2010 |
2011 |
| 14.36% |
10.4% |
1.08% |
-13.56% |
17.91% |
1.89% |
-2.15% |
| 2012 |
2013 |
2014 |
2015 |
2016 |
2017 |
| 6.48% |
3.28% |
6.13% |
0.36% |
1.86% |
8.07% |
* Performance in CHF, net of fees. Historical performance is based on approximation of the relevant Index Time Series within each investment strategy. Historical performance does not indicate or guarantee future returns.